
In today’s fast-paced digital world, ensuring the performance and reliability of applications is critical. Load testing has become an indispensable part of the software development lifecycle, helping teams identify bottlenecks, optimize performance, and deliver seamless user experiences.
Enter k6, a modern, developer-centric load testing tool that is redefining how we approach performance testing. In this blog, we’ll explore what k6 is, its key features, how it compares to traditional tools, and why it’s gaining traction in the tech community.
What is k6?
k6 is an open-source load testing tool designed for testing the performance of APIs, microservices, and websites. It is built with developers in mind, offering a simple yet powerful scripting experience using JavaScript. Unlike traditional load testing tools, k6 is cloud-native, highly scalable, and integrates seamlessly into CI/CD pipelines, making it a favorite among DevOps and engineering teams.
Key Features of k6
- Developer-Friendly: k6 scripts are written in JavaScript, making it accessible to developers who are already familiar with the language.
- Cloud-Native: Designed to work seamlessly in modern cloud environments, k6 supports distributed testing and integrates with platforms like Kubernetes.
- Real-Time Metrics: k6 provides real-time insights into performance metrics such as response times, request rates, and error rates.
- Extensibility: With a rich ecosystem of plugins and integrations, k6 can be extended to work with tools like Grafana, Prometheus, and InfluxDB.
- Scalability: k6 can simulate thousands of virtual users (VUs) from a single machine or scale out to distributed testing in the cloud.
- Open Source: k6 is free to use and has an active community contributing to its development.
k6 vs JMeter vs Gatling vs Locust
| Feature/Tool | k6 | JMeter | Gatling | Locust |
| Scripting Language | JavaScript | XML/Java | Scala | Python |
| Ease of Use | High (developer-friendly) | Medium (GUI-based) | Medium (Scala learning curve) | Medium (Python-based) |
| Cloud-Native | Yes | No | Partial | Partial |
| Scalability | High (built for distributed testing) | Medium (requires setup) | High | High |
| Real-Time Metrics | Yes | No | Yes | Yes |
| CI/CD Integration | Excellent | Partial | Good | Good |
How to Write a Test Script with K6?
Test scenario: Testing an e-commerce API with multiple endpoints, including user authentication, browsing products, and adding items to a cart. This example will showcase k6’s ability to handle stateful workflows and dynamic data.
In this scenario, we’ll simulate the following user flow:
- Login: Authenticate a user and retrieve an access token.
- Browse Products: Fetch a list of products.
- Add to Cart: Add a product to the user’s cart.
- Checkout: Simulate a checkout process.
Prerequisites:
- Install k6: Follow the official installation guide.
- Basic knowledge of JavaScript.
Example Script: E-Commerce API Load Test
1. Imports and Setup
This section imports the necessary modules from k6 and sets up the base URL for the API.

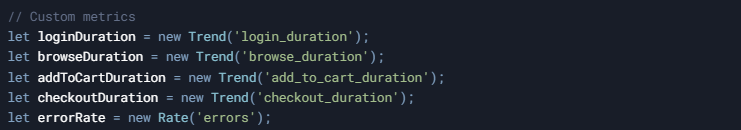
2. Custom Metrics
Here, we define custom metrics to track the performance of each step in the user flow.
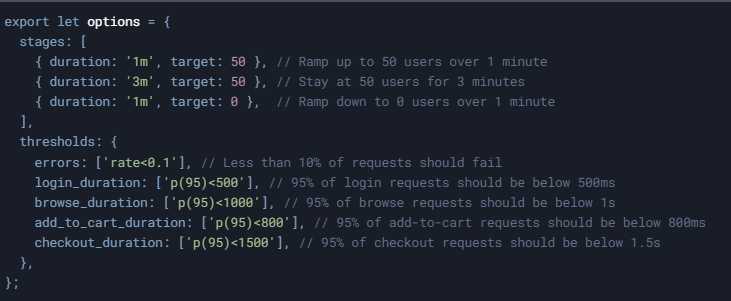
3. Test Configuration
This section defines the load test configuration, including the number of users, test duration, and performance thresholds.
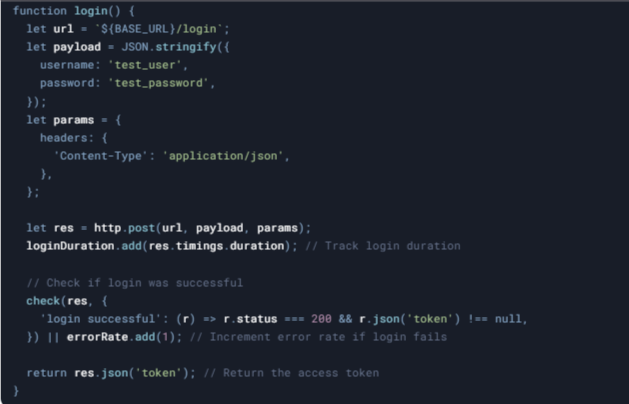
4. Helper Functions
These functions handle specific actions in the user flow (e.g., login, browse products).
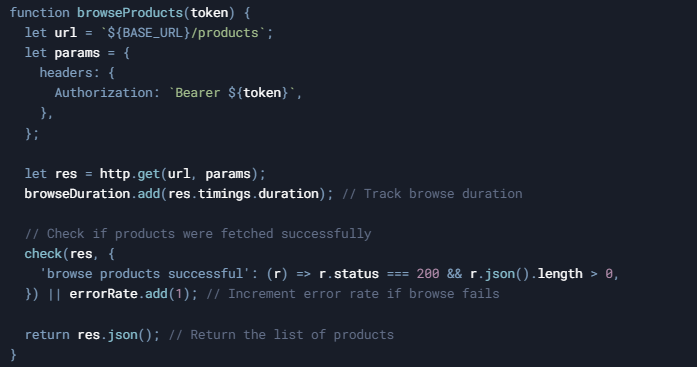
b. Browse Products Function
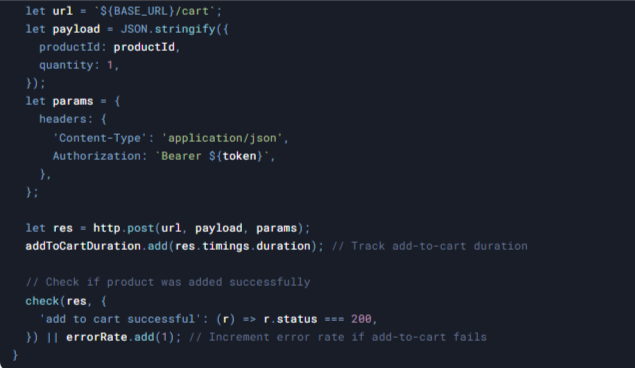
c. Add to Cart Function
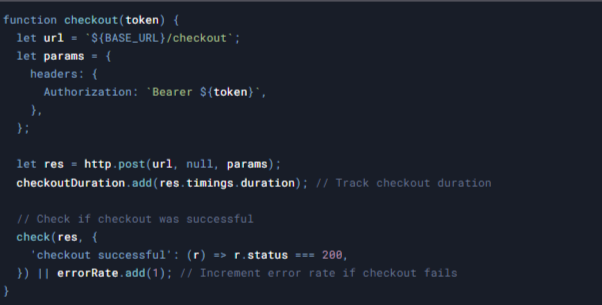
d. Checkout Function
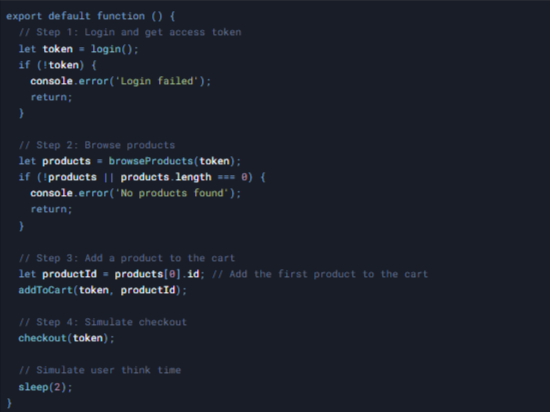
5. Main Function
This is the entry point for the test. It orchestrates the user flow by calling the helper functions in sequence.
6. Execution
To run the script, save it as ecommerce_test.js and execute it using the k6 CLI:

Expected Output:
k6 will execute the script and provide a detailed summary of the test results, including:
- Custom metrics (login_duration, browse_duration, etc.).
- Error rates.
- Threshold pass/fail status.
- A breakdown of HTTP requests and their performance.
7. Reporting and Visualization
Console Output – Review real-time test metrics directly in the terminal.
JSON Report – Save results for further analysis or integration:
Command: – k6 run ecommerce_test.js –out json=report.json
Web Dashboard (HTML Report) – Generate an interactive report:
Command: – K6_WEB_DASHBOARD=true K6_WEB_DASHBOARD_EXPORT=html-report.html k6 run ecommerce_test.js
k6 provides a detailed summary in the terminal. For better insights, you can integrate k6 with Grafana to create graphical reports.
Steps to Visualize Metrics in Grafana:
- Set Up a Time-Series Database: Use Prometheus or InfluxDB to store k6 metrics.
- Install k6 Extension: Add the Prometheus remote write extension:
k6 install github.com/grafana/xk6-output-prometheus-remote
3. Run the Test: Send metrics to Prometheus:
k6 run –out xk6-prometheus-remote script.js
4. Visualize in Grafana: Connect Grafana to Prometheus and create dashboards for:
- Response times (p95, p99).
- Error rates.
- Throughput (requests per second).
- Virtual users (VUs) over time.
k6 can generate an HTML report that provides a visual summary of the test results. To create the report:
1. Run the test with the –out flag to save results in JSON format:
k6 run –out json=results.json script.js
2. Use the k6-to-html tool to convert the JSON file into an HTML report:
k6-to-html results.json -o report.html
3. Open the report.html file in your browser to view the interactive dashboard.
Conclusion
k6 is revolutionizing load testing by making it simpler, more efficient, and highly integrable with modern DevOps workflows. Whether you’re a developer, tester, or performance engineer, adopting k6 can help ensure robust, scalable, and high-performing applications.
If you’re looking for expert K6 performance testing services, Testrig Technologies can help you optimize your applications with k6 and other industry-leading tools. Contact us today to enhance your testing strategy!


